
Actively Managed ETF Flows Increase Despite Performance Track Record
Total net assets of sustainable active and passive ETFs: December 30, 2022 – April 28, 2023
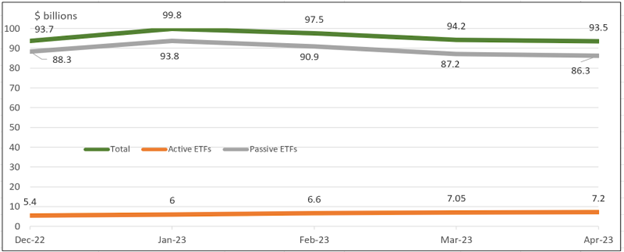
Sources: Morningstar Direct and Sustainable Research and Analysis
Despite historical performance, actively managed ETFs attract more inflows than their passive counterparts
According to reporting in the Wall Street Journal on May 3, 2023 investors have been directing outsized flows into actively managed exchange-traded funds versus index-tracking ETFs. While accounting for less than 6% of total assets, active ETFs have attracted about 30% of total flows to ETFs so far this year. This is being attributed to a greater interest in active management due to the turbulent market conditions as well as the “ease with which they allow investors to more easily trade specific strategies.” While this thinking may seem to be appealing in the short term, the fact is that a majority of active managers tend to underperform their benchmark. The underperformance rate in both categories and regions tends to increase with longer time horizons. Also, when funds outperform in a certain category, the outperformance doesn’t persist, and it doesn’t increase the odds of outperformance in a future period.
Fund flows this year have favored sustainable ETFs
The performance trend this year favoring passive funds to active funds can also be observed regarding sustainable ETFs through the end of April. During the first four months of the year, actively managed sustainable ETFs added $1.8 billion in assets or a gain of 33%. This compares to a $2.0 billion decline in the assets of passively managed ETFs, or 0.2% without adjusting for year-to-date market gains and the blockbuster launch in early April of the $2.0 billion Xtrackers MSCI USA Climate Action Equity ETF (USCA). The new ETF, which focuses on companies that are addressing and adapting to climate change, pulled in more than $2 billion in assets in its first day of trading, with the bulk of that money coming from the Finnish pension fund Ilmarinen.
Sustainable assets continue to rise with the launch of new sustainable fund launches
Actively managed sustainable ETFs reached $7.2 billion in assets at the end of April and account for 7.7% of sustainable ETF assets; they have also outpaced sustainable passively managed ETF new fund launches throughout 2022. However, active sustainable ETF launches are behind passive launches 9 to 11 respectively throughout the first 4 months of 2023.
It should be noted that about two-thirds of the four-month actively managed sustainable ETFs launches are due to 2 funds managers: Putnam Investment Management and Dimensional Fund Advisors, investing in US equities, international equities, and fixed-income securities. These funds, which were launched between November 2022 and January 2023 and likely sourced the bulk of the new money via internal sources, added $1.2 billion or 67% of the total four-month net gain. These funds include the Putnam ESG Core Bond ETF (PCRB), Dimensional US Sustainability Core 1 ETF (DFSU), Putnam PanAgora ESG International Equity ETF (PPIE), Putnam ESG Ultra Short ETF (PULT), Putnam ESG High Yield ETF (PHYD) and Dimensional International Sustainability Core 1 ETF (DFSI). Net expense ratios reported by these funds average 36 basis points and range from a low of 18 basis points to a high of 60 basis points.
Source: www.sustainableinvest.com