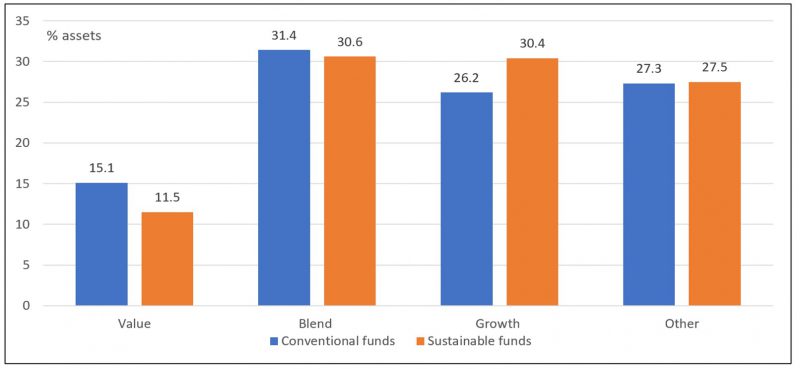
US large cap actively managed mutual funds: Allocation to value, blend and growth styles
Notes of Explanation: Value, blend and growth styles apply to large cap stocks. Others may include mid-cap and small-cap stocks as well as other equities or non-equity investments. Conventional funds include all US large cap actively managed mutual funds (excluding index funds, ETFs and sustainable funds). Data source: Morningstar Direct, as of November 30, 2022.
Unlike last year, US large cap actively managed sustainable mutual funds are likely to underperform in calendar year 2022
As calendar year 2022 comes to an end, stocks and stock funds are likely to deliver their worst returns since 2008, when the S&P 500 Index dropped -36.55%. Unlike last year when US large cap actively managed sustainable mutual funds outperformed conventional mutual funds on average (26.1% versus 23.9%), this year the reverse is likely to be true. Through the end of November, US large cap actively managed sustainable mutual funds posted a negative average return of 15.6% versus a negative 13.3% for their conventional mutual fund counterparts, or a negative variance of 2.3%. The average performance of conventional US large cap actively managed funds was more closely aligned to the S&P 500 Index that recorded a decline of 13.1% through the end of November.
Not only that, but about 54% of actively managed US large cap equity mutual funds have outperformed the S&P 500 Index on a year-to-date basis. Declining markets make active management skills all the more valuable, and based on data through the end of November, it looks like actively managed large cap equity funds are on track to achieve their best record of outperformance since 2009. The same can’t be said of US sustainable large cap equity mutual funds whose level of outperformance over the same interval is only at 25%, or 50% lower than conventional funds. Within this segment, however, 61% of growth oriented sustainable funds are beating the S&P 500 Growth Index.
Key lessons to improve the future of sustainable funds
It’s not clear to what extent sustainable fund managers’ stock picking across the large cap styles range is impacted in any way by their sustainable investing mandates. But this factor aside, reasons for divergence in their performance can be associated with a higher concentration in growth-oriented technology stocks in portfolios managed by sustainable funds, a slightly lower concentration in value stocks as well as lower exposures to the Energy sector’s fossil fuel stocks. Through the end of November, the S&P 500 Value Index and S&P 500 Growth Index posted divergent results, a negative 1.36% and 23.58%, respectively, or a dramatic difference of 22.2%. At the same time, the Information Technology and Communications Services sectors of the S&P 500 were down 22.4% and 35.3%. Conventional funds also benefited from their exposures to fossil fuel companies in the Energy Sector that was up 64.2% year-to-date.
A blended approach may be best suited for some investors over the long-term
Over the long-term, returns across conventional and sustainable funds are likely to harmonize, but a blended approach may be best suited for most investors who wish to avoid year-to-year variations due to style-based factors.
Research by Sustainable Research and Analysis LLC.

